
Conversion Rate Optimization (CRO) is the process of improving your website so that a higher percentage of the visitors who arrive convert into customers. It does not change how many people come to your site. It changes how many of the people already coming to your site actually buy. For a D2C brand spending money on paid advertising or SEO to drive traffic, a low conversion rate is the most expensive problem you can have because you are paying to acquire visitors who then leave without purchasing.
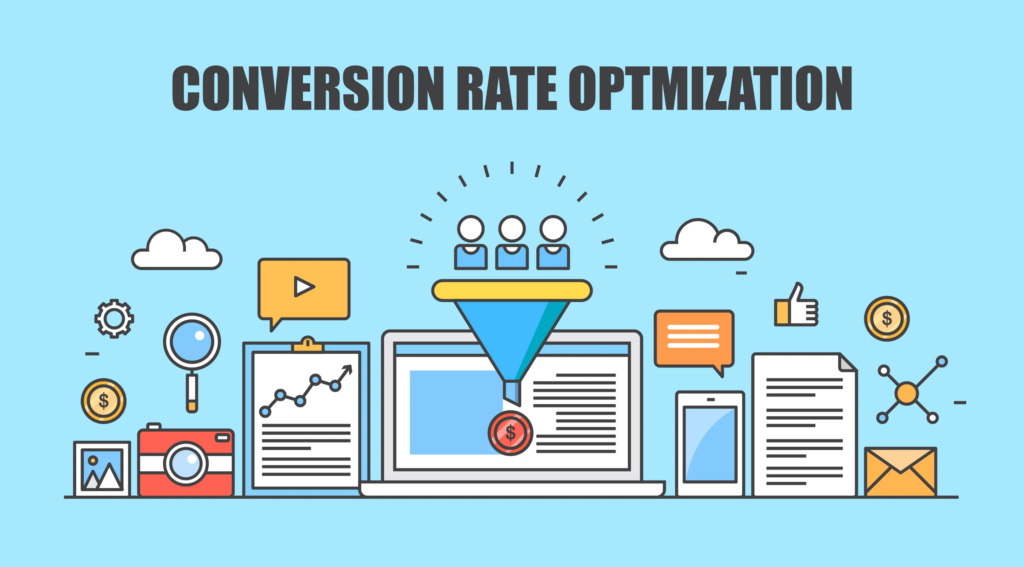
The average e-commerce conversion rate globally is between 1% and 4%. Most D2C brands fall in the 1% to 2% range. A brand converting at 1% that improves to 2% has doubled its revenue without spending a single additional rupee on advertising. That is the potential of CRO. And yet most D2C brands invest heavily in traffic and almost nothing in conversion.
This guide covers what CRO actually involves, the most common conversion killers on D2C websites in India, the USA, and the UAE, how to diagnose your specific conversion problems, and what a proper CRO process looks like.
What Does CRO Actually Involve?
Is CRO Just About Testing Button Colors?
No, and anyone who has told you it is that simple has been watching too many outdated marketing webinars. Changing a button from grey to green is a CRO tactic. CRO as a discipline is a systematic process of identifying why visitors are not converting, forming hypotheses about what would improve conversion, testing those hypotheses, and implementing the winners.
A proper CRO process starts with data, not assumptions. The data sources that drive CRO decisions:
Google Analytics behavior flow: Where are visitors dropping off? If 80% of visitors leave the product page without adding to cart, the problem is on the product page. If 60% add to cart but only 20% complete checkout, the problem is in the checkout flow.
Heatmaps and session recordings: Tools like Hotjar or Microsoft Clarity show where visitors click, how far they scroll, and what they ignore. A product page where most visitors never scroll past the hero image is a product page where the information below the fold is not influencing buying decisions.
Exit surveys: A short exit-intent survey asking “what stopped you from completing your purchase today?” generates direct qualitative data from real buyers who did not convert. The answers are frequently more useful than any quantitative analysis.
Funnel analysis: The conversion funnel from landing page to product page to cart to checkout to purchase. Each transition has a drop-off rate. The stage with the highest drop-off is typically where the most valuable CRO work happens.
What Are the Most Common Conversion Killers on D2C Websites?
Why Are Visitors Leaving Without Buying?
Slow page load speed: This keeps coming up because it is that important. A one-second delay in mobile page load time reduces conversions by approximately 20% according to Google’s research. In India, where a significant portion of e-commerce traffic comes from mobile devices on 4G connections with variable speeds, this problem is particularly acute. A Shopify store loading in 4 seconds on mobile in Jaipur is losing sales in a way that a store loading in 1.8 seconds is not.
Poor product page structure: Most D2C product pages are structured in the order that is convenient for the brand rather than in the order that is useful for the buyer. Hero image, product name, price, and add-to-cart button need to be visible above the fold on mobile without scrolling. Size guides need to be accessible without leaving the page. Social proof needs to be present and specific. Vague product descriptions that do not answer the buyer’s specific questions about material, fit, and care are a conversion killer.
Checkout friction: Every additional step in the checkout process increases the drop-off rate. Requiring account creation before purchase. Forcing users to re-enter shipping information they have already provided. Payment options that do not include the buyer’s preferred method (UPI and COD for India, card and BNPL for UAE and USA). A checkout process with six steps that could be three steps is costing you sales.
No trust signals: First-time buyers from a D2C brand they have not heard of before need reassurance. Reviews, return policies, secure payment badges, and contact information all contribute to trust. A product page with no reviews, no visible return policy, and no indication of who operates the store is asking first-time buyers to take a larger risk than most are comfortable with.
Unclear return and exchange policy: In categories where fit and quality uncertainty is high, a clear and customer-friendly return policy is one of the highest-impact conversion elements. “7-day hassle-free returns with home pickup” converts better than the same policy buried in a terms and conditions page written by a lawyer.
Mobile experience that is not properly optimized: Desktop-first design on a mobile-first audience. Images that take too long to load on mobile. Buttons too small to tap accurately. Text that requires zooming. Navigation that works on desktop but confuses on mobile. Any of these alone costs conversions. Combined, they guarantee a poor conversion rate.
Pricing presentation without value justification: A product priced at Rs. 2,499 with no explanation of why it costs what it costs asks the buyer to accept the price on faith. A product at Rs. 2,499 with a clear explanation of the 240 GSM heavyweight fabric, the 400,000 embroidery stitches, the Made in India production, and the limited-run scarcity gives the buyer a reason to say yes at that price.
How Do You Diagnose Your Conversion Problem?
What Should You Look at First?
Start with your overall conversion rate in Google Analytics. If it is below 1%, you have a significant problem that is likely affecting multiple stages of the funnel. If it is between 1% and 2%, you have room for meaningful improvement. If it is above 3%, you are doing many things right and the CRO opportunity is in specific stages rather than the whole funnel.
Then break down the funnel stage by stage. The highest-drop-off stage is where you focus first.
If the drop-off is between landing and product page, the problem is usually relevance mismatch. The ad promised something the landing page does not deliver.
If the drop-off is between product page and add-to-cart, the problem is usually product page quality. Something about the page is not answering the buyer’s questions convincingly.
If the drop-off is between add-to-cart and checkout initiation, the problem is usually cart page quality or checkout friction.
If the drop-off is within the checkout flow itself, the problem is usually payment options, required account creation, or unexpected costs (shipping charges appearing for the first time at checkout).
What Does a Proper CRO Process Look Like?
How Do Good Agencies Approach CRO?
A proper CRO engagement follows this sequence:
Audit phase: Collect quantitative data (Analytics, funnel data) and qualitative data (session recordings, heatmaps, exit surveys). Document every observed conversion problem with data supporting why it is a problem.
Hypothesis formation: Convert each observed problem into a testable hypothesis. “Visitors are dropping off at the checkout shipping step because unexpected shipping costs are appearing for the first time.” The hypothesis specifies the problem, the likely cause, and the proposed solution.
Prioritization: Not every CRO fix has the same potential impact. Prioritize by the combination of potential impact (how much could this move the conversion rate) and implementation difficulty (how long will this take to build and test).
Testing: A/B test significant changes where traffic volume allows. Implement high-confidence changes directly where testing would take too long to produce statistically significant results. Document everything.
Analysis and iteration: Measure the impact of each change. Feed learnings back into the next round of hypothesis formation. CRO is not a one-time project, it is a continuous process.
GoGrowth’s CRO work for Koora (Australia) improved conversion metrics alongside 7x ROAS from paid advertising. For Sthalam, a home decor brand in India, the CRO upgrade was part of a full-stack engagement that took the brand from zero to daily orders with 8x ROAS.
How to Get the Best CRO Results for Your Business
CRO is one of the highest-return investments a D2C brand can make because it multiplies the value of all your other marketing spend. Every rupee spent on paid advertising produces more revenue when the conversion rate improves. Every organic visitor from SEO is more likely to become a customer.
GoGrowth conducts CRO audits for D2C and e-commerce brands across India, USA, and UAE, identifying the specific conversion problems on your site and implementing solutions across page speed, product page structure, checkout flow, trust signals, and mobile experience.
To discuss what a CRO audit could find on your site and what the potential revenue impact might be, reach out at gogrowth.co/contact or on Instagram at @gurmeet__oberoi.
FAQ
What is a good conversion rate for a D2C e-commerce brand? The global average is 1% to 4%. A rate above 3% is considered strong. Most new D2C brands fall between 0.5% and 1.5%. If your conversion rate is below 1%, CRO should be your highest priority before spending more on traffic.
How long does CRO take to show results? Quick technical fixes like page speed improvement and checkout friction reduction can show impact within weeks. More significant changes to product page structure or navigation take longer to implement and to show statistically significant results. A proper CRO engagement produces meaningful conversion improvements within three to six months.
Is CRO only relevant for large e-commerce sites? No. Even a small D2C brand receiving 1,000 visitors per month benefits from CRO. The math is straightforward: a brand converting at 1% gets 10 purchases from 1,000 visitors. A brand converting at 2% gets 20 purchases from the same 1,000 visitors. That is double the revenue from the same traffic.
What is the difference between CRO and UX design? CRO and UX overlap significantly. UX design is the practice of designing interfaces that are easy and pleasant to use. CRO is specifically focused on the subset of UX improvements that increase conversion rates. Good UX generally improves conversion, but CRO applies a more specifically commercial lens.
How do I know if my e-commerce checkout has too much friction? If your checkout completion rate is below 40% of checkout initiations, you have significant friction. The average e-commerce checkout completion rate is 45% to 65%. Benchmark your rate against this and investigate the specific steps where drop-off is highest.Does CRO work for Shopify and WooCommerce stores? Yes. Both platforms have specific CRO considerations. Shopify has a relatively constrained checkout that limits customization, though Shopify Plus gives more flexibility. WooCommerce is more customizable but requires more technical CRO work. GoGrowth has CRO experience across both platforms.

Recent Comments